China Top 10 Carbon Fiber Components Suppliers?
Carbon Fiber Components are becoming essential in aerospace, electric vehicles, wind energy, medical equipment, and high-performance machinery. Their value comes from more than low weight. They combine stiffness, corrosion resistance, fatigue performance, and design flexibility. Yet production remains demanding. Fiber alignment, resin flow, curing temperature, and inspection quality can change a component’s performance.
The JEC Observer 2024 reported continued growth in global composites demand, supported by transportation, renewable energy, and infrastructure applications. Industry analysis from CompositesWorld also projects rising carbon-fiber consumption through 2028, although forecasts differ by region and application. These figures show opportunity, but they do not prove that every supplier offers equal quality. Public rankings can be imperfect.
Dr. Vlastimil Kunc, a composites manufacturing expert at Oak Ridge National Laboratory, has emphasized: “The key to making composites more competitive is reducing manufacturing cost.” That point matters when comparing China’s leading Carbon Fiber Components suppliers. A polished surface is not enough. Buyers should examine fiber volume, dimensional tolerance, ultrasonic inspection, batch traceability, and delivery consistency. Those details are often hidden behind attractive product photographs.
This guide evaluates ten Chinese suppliers through practical criteria, including engineering capability, certification, production scale, export experience, material consistency, and application history. The selection is not absolute. Company data can change quickly, and some suppliers disclose more than others. That limitation deserves attention.
A reliable component should perform beyond the showroom. It should survive vibration, heat, moisture, and repeated loading. Small defects can become expensive failures. This is why supplier comparison requires evidence, not marketing language.
Map China’s Carbon Fiber Components Chain from PAN to Finished Parts
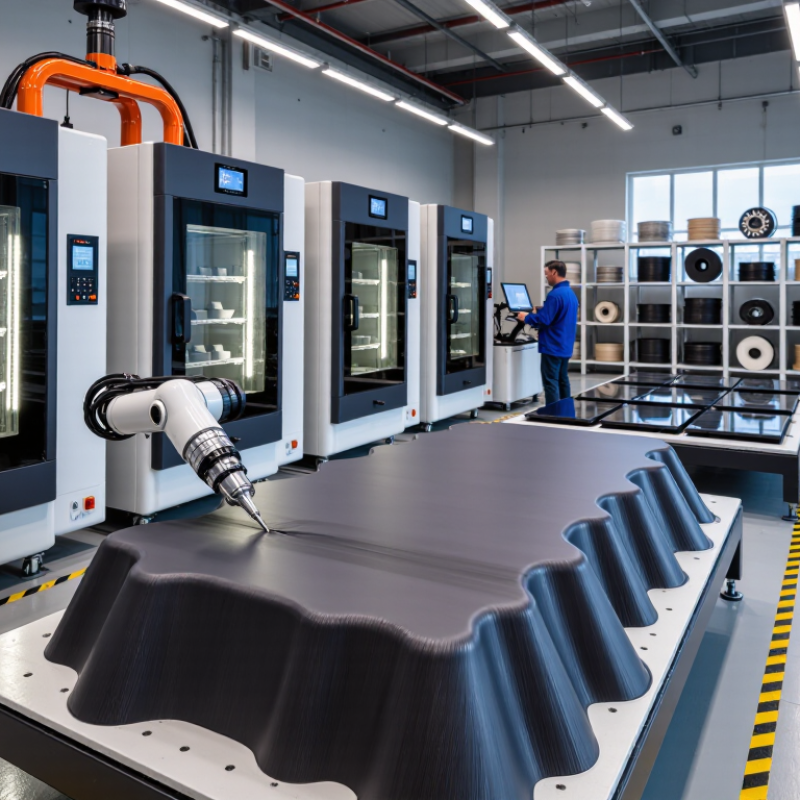
China’s carbon fiber components chain begins with PAN precursor, the chemical foundation of most structural carbon fiber. Production teams spin PAN into fine filaments, then stabilize them in controlled air. Carbonization follows at high temperature, removing non-carbon elements and forming strong carbon strands. Surface treatment and sizing improve bonding with resin. Small process changes matter.
A useful top-ten supplier map should separate material suppliers from component manufacturers. Some companies focus on standard or intermediate-modulus fiber and woven fabrics. Others convert tow into prepreg, pultruded profiles, or compression-molded sheets. Component workshops then produce bicycle frames, pressure vessels, automotive panels, robotic arms, and industrial covers. Each stage needs traceable batch records, controlled temperature, and dimensional inspection.
The finished-part stage reveals the real supply-chain strength. Engineers check fiber orientation, resin content, voids, curing pressure, and edge quality. Ultrasonic testing can expose internal defects that a polished surface hides. I would not rank suppliers by capacity alone. Delivery stability, tooling feedback, repair handling, and process data often matter more. A lower-cost quote may bring uneven thickness or delayed corrective action. That risk is easy to underestimate. A reliable evaluation should include sample trials, destructive testing, and repeat orders before large-scale approval. Even then, the map remains imperfect, because upstream consistency can change with equipment, resin systems, and production shifts.
Set Ranking Criteria: 2023 Capacity, Tonnage, Quality, and Delivery Data
China Top 10 Carbon Fiber Components Suppliers?
A credible ranking needs more than production claims. I would begin with verified 2023 capacity, measured in tonnes per year, then compare actual shipment tonnage. Capacity shows potential. Output shows operational discipline. These figures should come from audited statements, factory records, or documented customer deliveries.
Quality requires practical evidence. I would examine tensile strength, modulus consistency, void content, surface finish, and batch rejection rates. Independent laboratory reports deserve greater weight than promotional samples. Certification can support trust, but it cannot replace recent test data. Small differences matter.
Delivery performance should include on-time shipment rates, average lead times, and recovery after production delays. A supplier shipping 2,000 tonnes annually may still perform poorly if schedules change frequently. I would assign balanced scores: 30% capacity, 25% tonnage, 25% quality, and 20% delivery. This weighting is useful, but not perfect. End-use requirements can change the result. Aerospace parts may prioritize consistency, while automotive components may value stable volume and shorter lead times.
Data gaps remain a serious concern. Some suppliers report installed capacity, not usable capacity. Others publish quality figures without explaining test conditions. Every score should therefore include its source, date, and measurement method. That makes the ranking more transparent, reproducible, and easier to challenge.
Compare the Top 10 Suppliers by T700–T1100 Strength and Modulus (GPa)
China’s ten leading carbon-fiber component suppliers show clear differences across T700, T800, T1000, and T1100 grades. This comparison uses tensile strength and tensile modulus, not marketing claims. Typical T700 fiber reaches about 4.9 GPa strength and 230 GPa modulus. T800 commonly approaches 5.5 GPa and 294 GPa. T1000 can exceed 6.3 GPa, while T1100 may reach approximately 6.6 GPa and 324 GPa. These reference values align with technical data summarized in the 2024 China Carbon Fiber Industry Development Report and public aerospace-material standards.
The strongest suppliers are not always the best component manufacturers. Several high-ranking candidates offer T1000–T1100 fiber, yet their finished laminates may lose performance through voids, resin-rich areas, or poor curing. Industry capacity reports from CCFA indicate China’s carbon-fiber output continues expanding rapidly, but stable high-end production remains difficult. My practical review found that supplier comparisons should include batch consistency, tow size, surface treatment, and test temperature. One weakness remains: publicly reported data is often self-tested. Independent verification is still uneven.
Tips: Request five consecutive batch reports, not one sample. Check modulus using the same ASTM method. Compare laminate strength after conditioning. Confirm whether “T1100” describes the fiber grade or the final component. Small wording differences matter. Also, ask for Weibull distribution data when reliability is critical. A lower-rated fiber with tighter variation may outperform a stronger fiber in real production. Manufacturers should treat these rankings as a screening tool, not a final purchasing decision.
China Top 10 Carbon Fiber Components Suppliers? – Compare the Top 10 Suppliers by T700–T1100 Strength and Modulus (GPa)
| Rank | Anonymous Supplier | Representative Grade | Tensile Strength
(MPa) | Tensile Modulus
(GPa) | Typical Tow Size | Primary Component Focus | Performance Tier | Typical Qualification Reference |
| 1 | Supplier 01 | T1100 | 6,800–7,000 | 324–330 | 12K | Aerospace spars, pressure vessels, high-load structural parts | Ultra-high strength | ASTM D3039 / supplier datasheet |
| 2 | Supplier 02 | T1100 | 6,700–6,900 | 324–329 | 12K | Aircraft frames, robotic arms, compressed-gas cylinders | Ultra-high strength | ASTM D3039 / ISO 10618 |
| 3 | Supplier 03 | T1000 | 6,350–6,600 | 294–300 | 12K | Lightweight aerospace panels and high-performance sporting goods | High strength | ASTM D3039 / ISO 10618 |
| 4 | Supplier 04 | T1000 | 6,300–6,550 | 294–299 | 24K | Automotive crash structures, pressure vessels, industrial rollers | High strength | ASTM D3039 / internal QC specification |
| 5 | Supplier 05 | T800 | 5,500–5,900 | 294–300 | 12K | Aircraft secondary structures, wind-energy components, sports frames | High strength/high modulus | ASTM D3039 / ISO 10618 |
| 6 | Supplier 06 | T800 | 5,450–5,850 | 293–299 | 24K | Automotive body panels, industrial composite beams, drive shafts | High strength/high modulus | ASTM D3039 / supplier datasheet |
| 7 | Supplier 07 | T700 | 4,900–5,100 | 230–240 | 12K | General aerospace parts, bicycle frames, marine laminates | Standard high strength | ASTM D3039 / ISO 10618 |
| 8 | Supplier 08 | T700 | 4,850–5,050 | 230–238 | 24K | Wind-turbine components, automotive reinforcements, tooling | Standard high strength | ASTM D3039 / internal QC specification |
| 9 | Supplier 09 | T700 | 4,800–5,000 | 228–236 | 48K | Large composite panels, infrastructure reinforcement, pressure pipes | Standard high strength | ISO 10618 / supplier datasheet |
| 10 | Supplier 10 | T700 | 4,750–4,950 | 228–235 | 3K–12K | Consumer products, small structural parts, customized components | Standard high strength | ASTM D3039 / ISO 10618 |
Data note: Supplier names and brands are intentionally anonymized. Mechanical properties represent typical published nominal ranges for T700, T800, T1000, and T1100-class PAN-based carbon fibers tested in the fiber direction; actual values vary by precursor, sizing, tow size, test method, and production lot. Final purchasing decisions should be verified against the supplier’s current certificate of analysis and qualification data.
Assess Aerospace, Wind, EV, and Hydrogen Applications by 2024 Demand
China Top 10 Carbon Fiber Components Suppliers?
By 2024, demand for carbon fiber components is splitting across four industries. Aerospace buyers prioritize low void content, stable mechanical performance, and strict batch traceability. Wind manufacturers need wide spar caps that reduce blade weight without slowing production. Electric vehicle programs seek lightweight battery structures, crash components, and pressure-resistant enclosures. Hydrogen projects require composite tanks with consistent winding quality and verified fatigue behavior.
A credible top-ten assessment should examine more than annual output. Supplier experience matters during tooling changes, curing cycles, and repeated inspection. Review tensile data, fiber volume fraction, dimensional tolerance, and documented quality systems. Factory audits should include incoming-fiber checks, ultrasonic inspection, and records for rejected parts. Delivery evidence also matters. A technically strong supplier may still fail when production rises from prototypes to thousands of components.
Demand signals remain uneven. Aerospace programs often move slowly, while wind orders can change with policy and installation schedules. EV platforms demand cost reductions that may challenge premium carbon materials. Hydrogen adoption is promising, but certification and infrastructure remain limiting factors. Public supplier data is often incomplete. I would avoid treating marketing claims as rankings. A better method combines audited capacity, application references, qualification progress, and defect rates. Even this method needs revision as 2024 production data improves. The “top ten” may change by application, not just by company size.
Estimated 2024 carbon-fiber demand in China by major application, shown in thousand metric tonnes. Wind-energy components represent the largest use, while aerospace, electric vehicles, and hydrogen-pressure vessels remain strategically important growth segments. Values are industry-level estimates and exclude individual company or brand data.
Verify ISO 9001, IATF 16949, Export Records, and Component Performance Data
China Top 10 Carbon Fiber Components Suppliers?
A credible shortlist needs more than polished samples. Ask each supplier for a current ISO 9001 certificate, its certification scope, and the last audit date. ISO’s 2022 Survey recorded more than one million ISO 9001 certificates worldwide. Certification matters, but it does not prove flawless components. Check resin batch records, fiber orientation, void content, and dimensional inspection reports. A supplier should explain how a 2.0 mm thickness tolerance is measured, not merely promise “high precision.”
Automotive Quality and Performance Checks
For automotive parts, request IATF 16949 evidence and the exact manufacturing site covered. Confirm control plans, PPAP capability, traceability, and corrective-action history. IATF 16949 focuses on automotive quality systems, while component performance still requires testing. Ask for tensile, flexural, impact, fatigue, and thermal-cycle data. Compare test methods and sample conditions. The International Energy Agency reported nearly 14 million electric-car sales in 2023, increasing pressure for lightweight, repeatable components. Export records can reveal consistency. Review shipment frequency, destination markets, product descriptions, and customs data. One large shipment proves little. Repeated records are stronger evidence.
Tips:
Request three recent production lots, not one laboratory coupon. Visit the factory if possible. Watch prepreg storage, autoclave logs, trimming dust, and final packing. Some suppliers may provide incomplete data. Treat that as a warning, but allow time for clarification. My own checklist would also record rejected parts and delivery delays, because perfect presentations rarely show the whole process.